
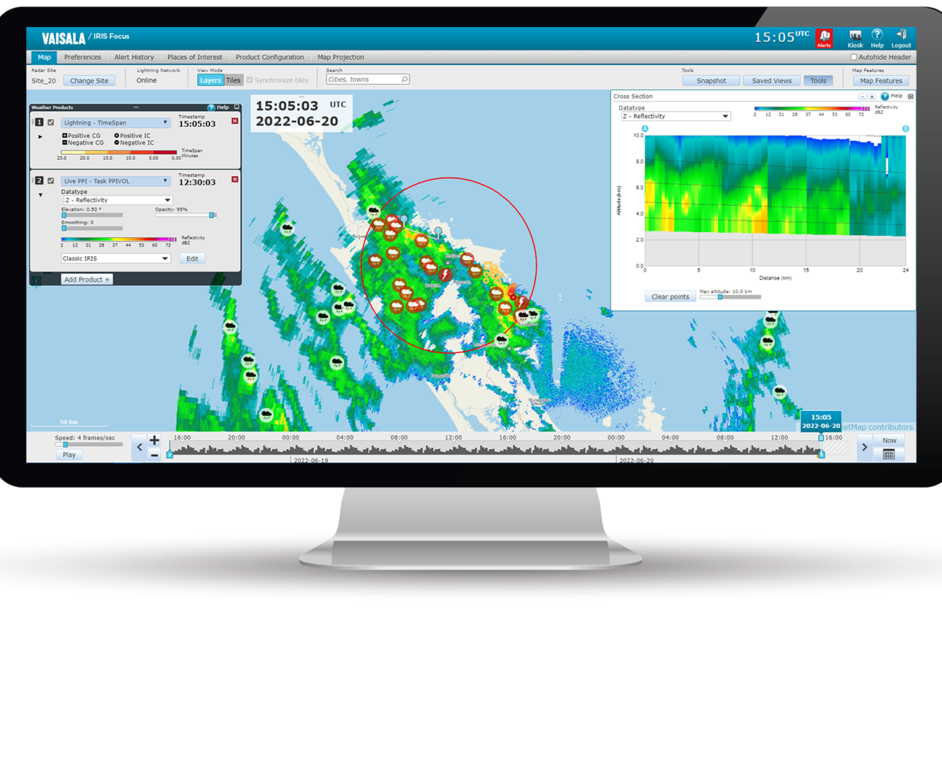
Supported pregenerated products
The following tables provide an overview of the pregenerated products supported in IRIS Focus.
| Product | Description |
|---|---|
|
BASE Echo Base |
BASE is used to determine the base of echoes. 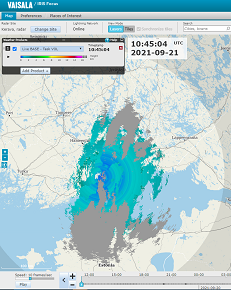
|
|
BEAM Antenna Beam Pattern |
BEAM is a full screen cross-section format image showing range-averaged intensity in azimuth and elevation coordinates. BEAM is used during calibration and alignment and to verify antenna patterns. |
|
CAPPI Constant Altitude PPI |
CAPPI is a horizontal cut at a selected altitude used for surveillance and severe storm identification. It is also useful for monitoring the weather at specific flight levels for air traffic applications. 
|
| HMAX Height of Maximum Intensity Product |
HMAX displays the height of the maximum data above each output pixel. This product requires a volume scan. |
| LAYER |
LAYER can compute layer averages of any polar data types in the ingest files. LAYER can also convert to liquid first and compute VIL Density. When computing VIL Density, the output is in g/m**3. |
|
MAX Maximum Data |
MAX shows the maximum data over each pixel as well as the East-West and North-South maximum projects in side panes. 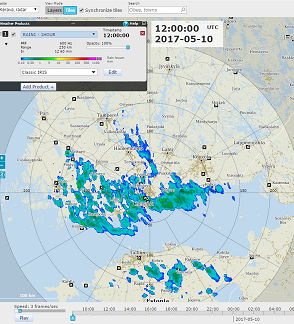
|
|
MLHGT Melting Level Height |
MLHGT displays a map of the melting layer altitudes. |
| MVF Motion Vector Field |
The motion vector field (MVF) describes the general motion of weather in a set of products. IRIS Focus calculates current motion vectors (MVF) as the first step in nowcasting calculations. |
|
PPI Plan Position Indicator |
PPI is a full screen image used primarily for weather surveillance purposes. 
|
|
RAIN1 Hourly Rain Accumulation |
RAIN1 is hourly rainfall accumulation. 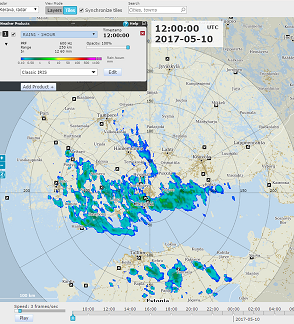
|
|
RAINN
|
RAINN is
rainfall accumulation of the last 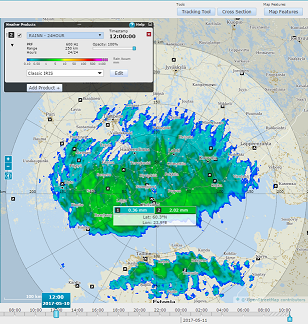
|
| RHI Range Height Indicator |
RHI is a full screen image showing the detailed cross-sectional structure of a storm, used for identifying severe storms, hail and bright band. 
|
|
RTI Range Time Indicator |
RTI displays time along the horizontal axis and the vertical axis displays range from the radar. Often used for manual scans when observing a fixed target. 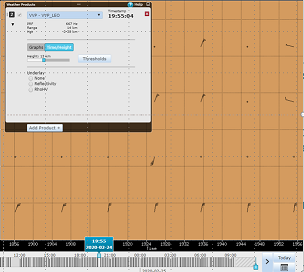
|
|
SRI Surface Rainfall Intensity |
SRI provides input for the RAIN1 product to obtain the best possible estimates of accumulated precipitation even at longer ranges from the radar. 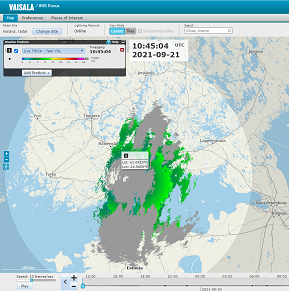
|
|
SHEAR Wind Shear |
SHEAR detects wind shear in the atmosphere, allowing the detection of microbursts, gust fronts, mesocyclones, cold fronts, and atmospheric waves. |
|
SLINE Shear Line (frontal boundary) |
SLINE marks the transition between two air masses on the image. 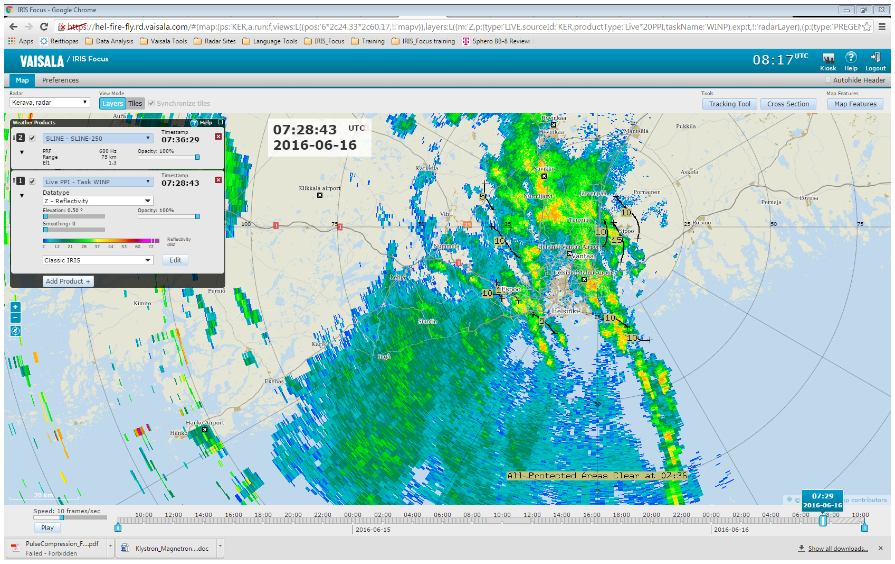
|
|
THICK Echo Thickness |
THICK shows the thickness of cloud echoes. THICK is the same as the difference between the TOPS and BASE values. The THICK product also computes the average reflectivity in the layer identified by the selected dBZ Contour. 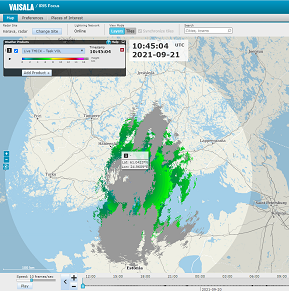
|
|
TOPS Echo Tops Map |
TOPS is a color-coded contour map of the top of a selected dBZ level. Either Z or ZT can be used as the basis for the estimate. 
|
|
VAD Velocity Azimuth Display |
VAD is a display of the mean Doppler velocity at a given range as a function of the azimuth angle as the radar antenna rotates through an azimuth scan at a constant elevation. |
|
VIL Vertically Integrated Liquid |
VIL is a color-coded map of the estimated depth of water (in mm) contained in a selectable atmospheric layer. This is an excellent indicator of severe storms. |
| VVP Velocity Volume Processing |
VVP provides line graphs or time against height cross-sections of wind speed, wind direction and divergence against height. 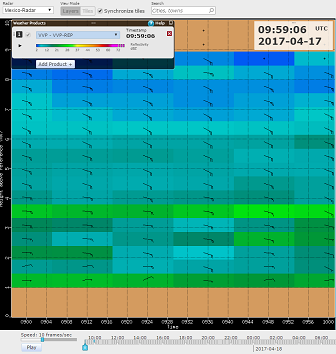
|
|
WARN Warning/Centroid |
WARN is automatic alerting and centroid plotting. Automatic alerts can be set for areas of interest and user-selectable warning criteria. Output is an alert message and a situation overlay showing the centroid locations of storm features, such as high VIL or reflectivity. 
|
|
WIND Wind Speed and Direction |
WIND displays wind speed and direction with either wind bards or wind strings. You can specify the range and height of the data, and the range and azimuth spacing of the lines that are displayed. 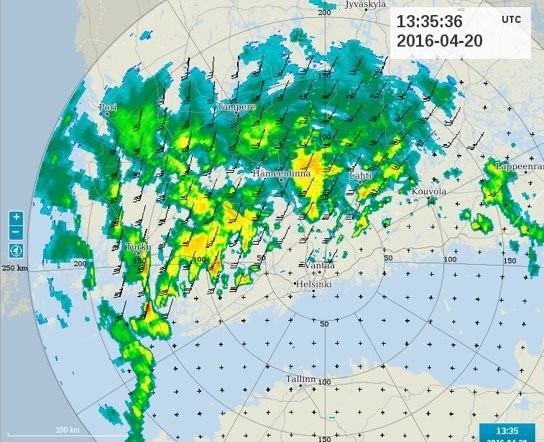
|