
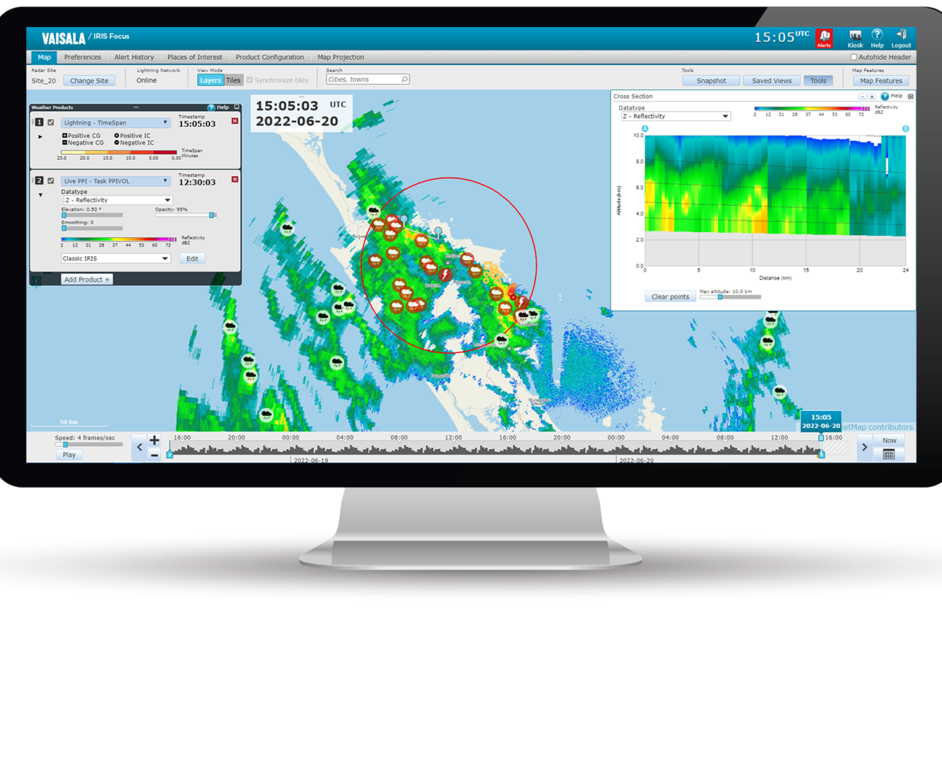
Constant Altitude Plan Position Indicator (CAPPI)

On-demand CAPPI (Constant Altitude PPI) displays a horizontal cross-section of the signal reflectivity at the selected altitude.
In the following cross-section image, the CAPPI product is calculated for a defined 5 km constant altitude. The red lines represent the interpolation from the ray data while the black line represents the constant altitude.

 | The image does not show the cloud reflectivity values that are included in an actual CAPPI product. |
| Optional radar product smoothing is performed on the bitmap image, not on the volume data. |