
Pseudo CAPPI
Select the Pseudo CAPPI option to add pseudo CAPPI calculations to your CAPPI product.
Pseudo CAPPI attempts to visualize those parts within the radar range that are not measured directly, including, for example, the area immediately around the radar, and the volume border with the highest altitude.
In the first cross-section image, the CAPPI product is calculated from ray data for a defined constant altitude. The red lines represent the interpolation from the ray data while the black line represents the constant altitude.
The heavy red lines in the second cross-section image indicate how the Pseudo CAPPI product uses the value of the closest ray to extend the CAPPI product above and below the constant altitude.
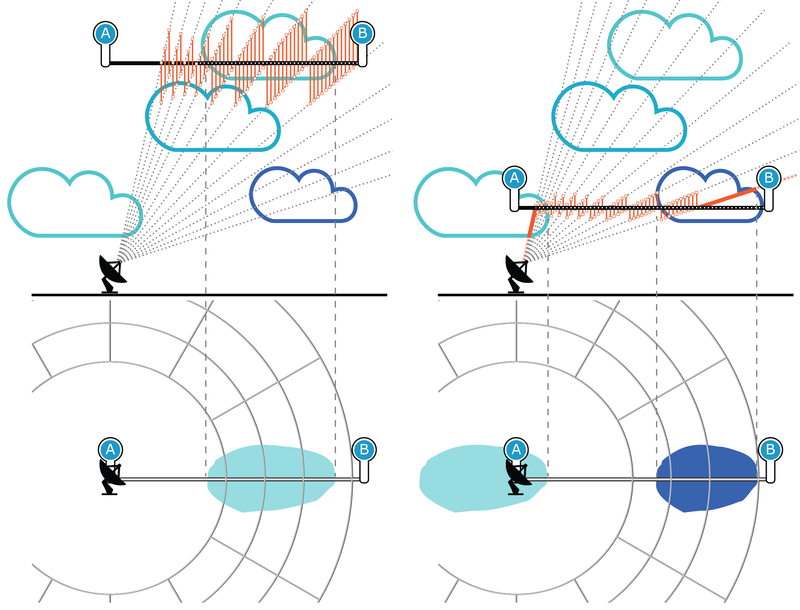
 | The image does not show the cloud reflectivity values that are included in an actual CAPPI product. |
| For Pseudo CAPPI, not all data comes from the CAPPI height and may be quite far from the actual height. |