Product colors
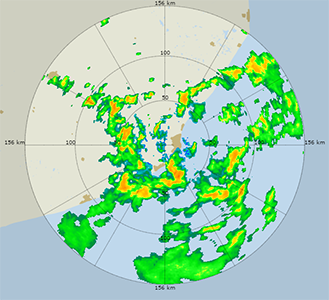
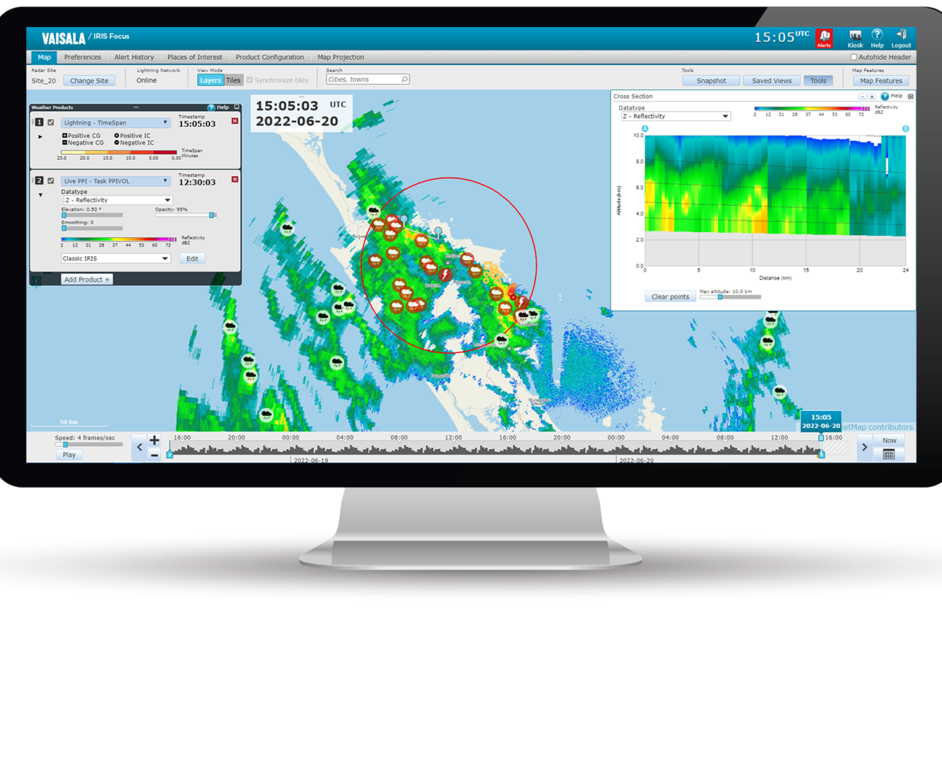
The product visualizations are drawn on the map using an editable color scale gradient, which illustrates the intensity of the detected weather phenomena or values of the received signal. The default color scales are useful for most conditions, and you can edit them further with the built-in color scale editor.
Users with both admin role and focus role can create global color scales that are available for all users in the organization.